
In today’s competitive digital landscape, businesses are flooded with data but often struggle to turn that data into meaningful action. Monitoring key performance indicators (KPIs), calculating return on investment (ROI), and tracking growth metrics are no longer optional—they’re essential for survival and scalability. The right analytics tools don’t just collect numbers; they provide clarity, direction, and competitive advantage. Below, we explore six must-have analytics tools that empower businesses to measure what matters most and grow strategically.
TLDR: Businesses need reliable analytics tools to effectively monitor KPIs, ROI, and growth metrics. From website tracking to financial analytics and customer insights, the right platforms turn raw data into strategic decisions. This article highlights six essential tools and includes a comparison chart to help you choose the best fit. If you want smarter business decisions backed by real-time insights, these tools are a strong starting point.
Contents
Why Analytics Tools Matter for Modern Businesses
Before diving into specific tools, it’s important to understand why analytics platforms are critical. Data-driven companies are more agile, make fewer costly mistakes, and respond faster to market changes. Analytics tools help businesses:
- Track measurable KPIs aligned with strategic goals
- Calculate precise ROI on marketing and operational investments
- Identify growth opportunities and bottlenecks
- Make informed forecasting decisions
- Improve accountability across teams

Without visibility into performance metrics, scaling becomes guesswork. With the right tools, growth becomes deliberate.
1. Google Analytics 4 (GA4)
Best for: Website performance, user behavior tracking, conversion monitoring
Google Analytics 4 is an essential foundation-level analytics tool for businesses with an online presence. It provides detailed insight into how users interact with websites and apps.
Key Benefits:
- Event-based tracking for flexible measurement
- Cross-device and cross-platform insights
- Custom conversion tracking
- Advanced audience segmentation
- Predictive metrics powered by machine learning
GA4 allows businesses to measure traffic sources, user journeys, engagement rates, and conversion funnels. If your KPI involves website leads, purchases, sign-ups, or downloads, this tool is non-negotiable.
For ROI calculations, businesses can connect GA4 with advertising platforms to measure cost-per-acquisition (CPA) and customer lifetime value (CLV).
2. Microsoft Power BI
Best for: Business intelligence and interactive data visualization
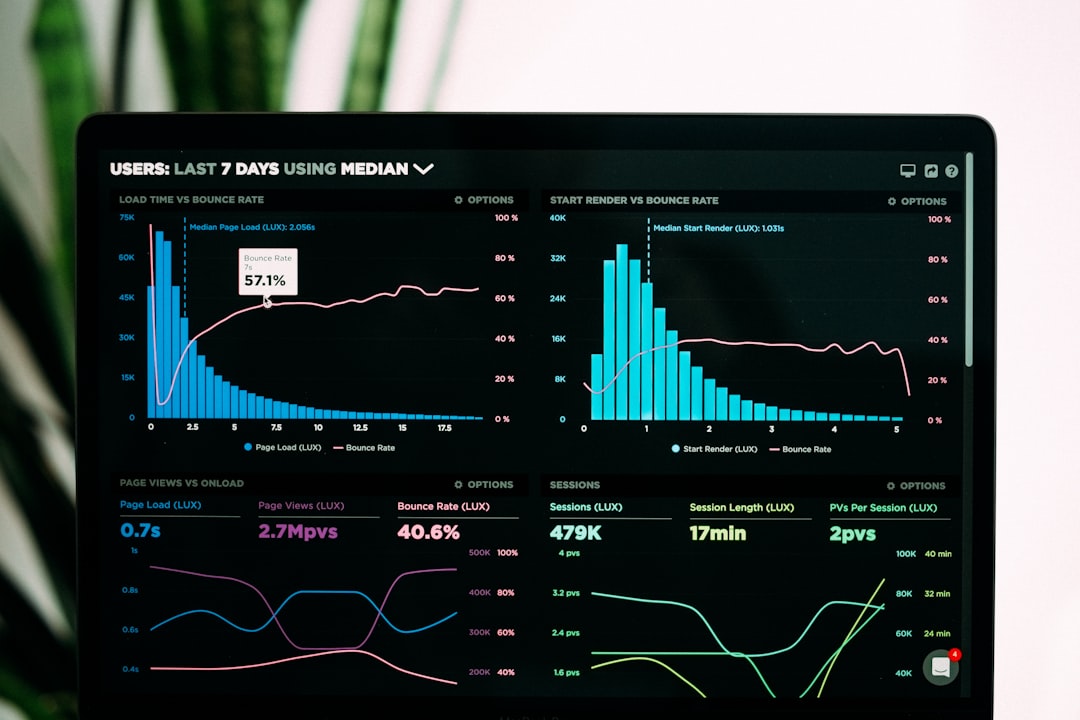
Power BI turns complex data sets into interactive dashboards that are easy to understand. It integrates with multiple data sources including CRM systems, accounting software, spreadsheets, and cloud services.
Why businesses love it:
- Real-time dashboard updates
- Custom KPI visualization tools
- AI-driven data modeling
- Easy integration with enterprise systems
Instead of manually compiling reports, stakeholders can view performance data in one centralized hub. Executives often use Power BI to monitor financial KPIs, sales targets, operational efficiency, and department-specific growth metrics.
The biggest advantage? Decision-makers can identify trends instantly rather than wait for monthly reports.
3. HubSpot Analytics
Best for: Marketing ROI and customer journey tracking
For companies focused on inbound marketing and customer acquisition, HubSpot’s analytics suite provides an all-in-one tracking environment.
Core Features:
- Marketing campaign performance tracking
- Lead attribution reporting
- Sales pipeline analytics
- Email marketing metrics
- Customer lifecycle reporting
One of its strongest capabilities is multi-touch attribution, which allows businesses to identify which channels contribute most to conversions. Instead of guessing whether paid ads, blog content, or email campaigns drive sales, businesses get clarity.
This improves budget allocation and increases marketing ROI over time.
4. Tableau
Best for: Advanced data visualization and enterprise analytics
Tableau is known for its powerful visualization capabilities. It allows businesses to transform large, complex datasets into interactive and highly visual dashboards.
Key Advantages:
- Deep data exploration tools
- Custom KPI dashboards
- Scalable enterprise deployment
- Strong data blending capabilities
Tableau is particularly valuable for growth-focused companies dealing with multiple revenue streams or international markets. It enables side-by-side comparison of growth patterns across regions, campaigns, and products.
While it has a learning curve, its flexibility makes it ideal for businesses that require highly customized reporting.
5. QuickBooks Analytics (or Similar Accounting Analytics Tools)
Best for: Financial KPIs and ROI tracking
Financial metrics remain the backbone of performance measurement. Accounting analytics tools provide insight into:
- Revenue growth
- Cash flow trends
- Expense breakdown
- Profit margins
- Customer acquisition costs
With integrated analytics dashboards, business owners can monitor financial health in real time. This makes ROI calculation straightforward: compare campaign or operational costs directly against revenue outcomes.
For small to mid-sized businesses, accounting-based analytics tools bridge the gap between operational activities and financial performance.
6. Mixpanel
Best for: Product analytics and user engagement metrics
If your business operates a SaaS platform, mobile app, or digital product, Mixpanel provides detailed behavioral analytics.
What it tracks:
- User engagement metrics
- Feature adoption rates
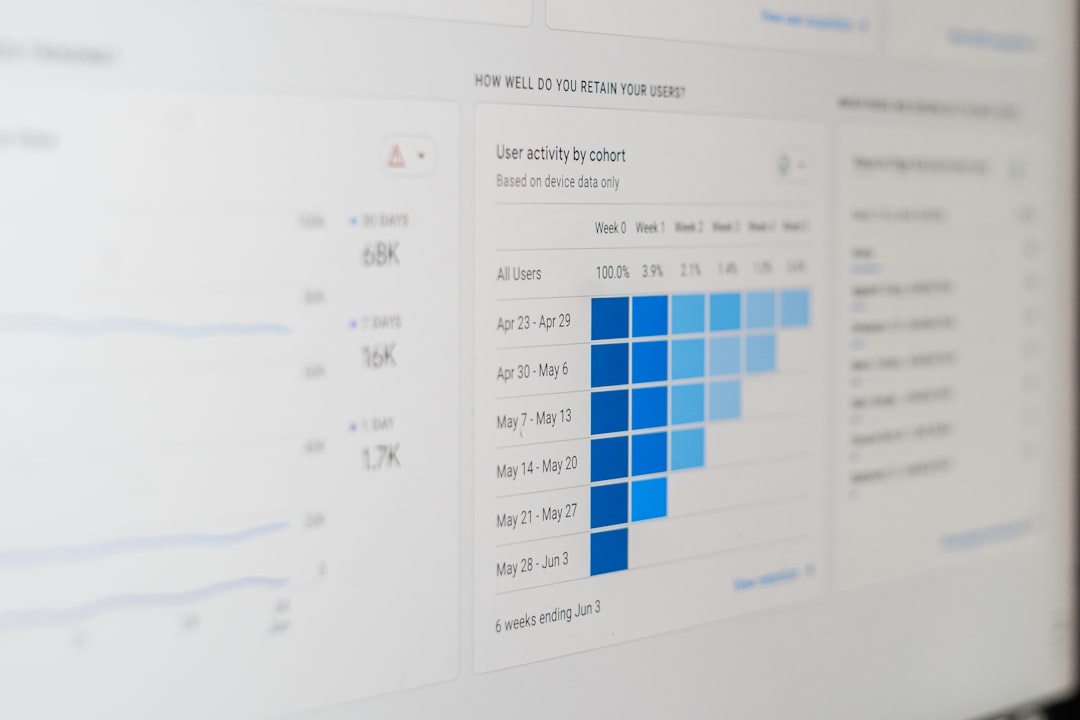
- Retention and churn rates
- Conversion funnels
- Cohort analysis
Understanding how customers use your product is essential for sustainable growth. Mixpanel helps identify drop-off points in user journeys and reveals which features drive long-term retention.
This leads to smarter product development decisions and higher customer lifetime value.
Comparison Chart: Top Analytics Tools for Businesses
| Tool | Primary Focus | Best For | Ease of Use | Scalability |
|---|---|---|---|---|
| Google Analytics 4 | Website & app tracking | Digital marketing KPIs | Medium | High |
| Microsoft Power BI | Business intelligence | Company-wide dashboards | Medium | Very High |
| HubSpot Analytics | Marketing & sales metrics | Lead generation & ROI | High | High |
| Tableau | Advanced visualization | Enterprise analytics | Medium-Low | Very High |
| QuickBooks Analytics | Financial reporting | Revenue & ROI tracking | High | Medium |
| Mixpanel | Product analytics | SaaS & app growth | Medium | High |
How to Choose the Right Analytics Stack
Most businesses don’t rely on just one tool—they build an analytics stack. The ideal combination depends on:
- Your industry
- Your growth stage
- Your budget
- Your internal technical expertise
- Your core KPIs
For example:
- A startup might combine GA4 + HubSpot + QuickBooks.
- A mid-sized ecommerce brand may add Power BI for centralized dashboards.
- A SaaS enterprise could implement Mixpanel + Tableau for deep product analytics.
The key is integration. When tools share data, reporting becomes faster, more accurate, and more actionable.
Final Thoughts
Tracking KPIs, ROI, and growth metrics is not just about reporting performance—it’s about shaping the future of your business. The six tools outlined above provide distinct but complementary capabilities, from financial tracking to customer journey analysis and product insights.
The most successful companies are those that treat analytics as a strategic asset, not a periodic task. By investing in the right platforms and aligning them with long-term objectives, businesses can unlock smarter decision-making, optimize spending, and accelerate sustainable growth.
Data doesn’t build businesses—clarity does. And the right analytics tools provide that clarity.


